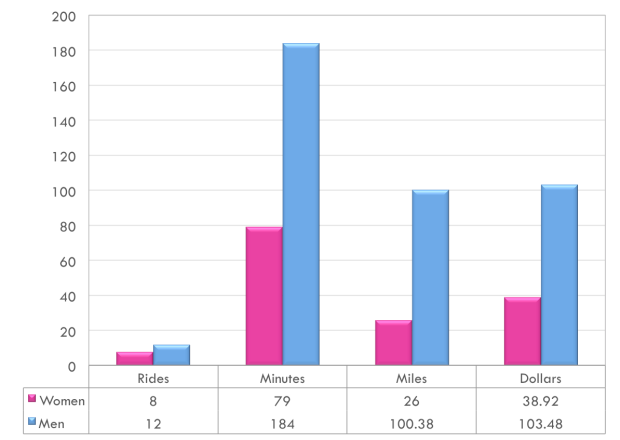
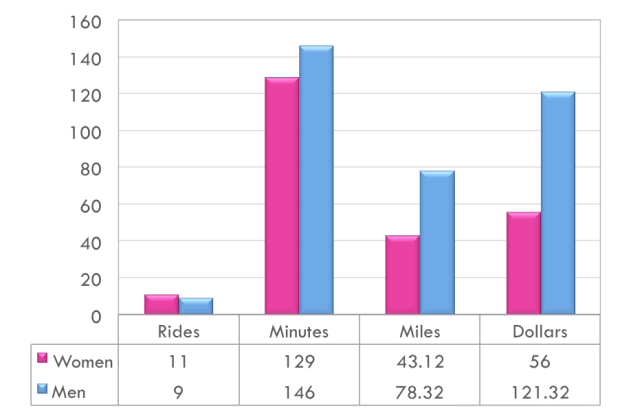
I wanted to compare my first two weeks – especially since they were the same number of rides and very similar time spent online. Please note: I did not include tips or my $50 referral bonus (week 2) in the “Dollars” section of the graph.
One of the biggest differences between Week 1 and Week 2 was that I didn’t experience any surge pricing like I had my first week. I did hit 25 rides during Week 2 which led to my $50 bonus but without this I made only $16.07 per hour compared to the $20.74 from the previous week.
I found it interesting to compare the amount of time (minutes) I spent driving to pick up the riders as I spent bringing the rider from Point A to Point B. The results are comparable between categories: “Minutes with Passenger” and “Minutes Online” which means I’m spending just as much time driving to pick up locations as I am dropping off. It will be best to minimize the time spent in between rides but this will depend on demand, location and Uber’s algorithm.
You will notice the amount of tips made was drastically difference between weeks. This will be interesting to keep track of because at this point I don’t have a real explanation for why this happened.